
Holiday ecommerce sales are expected to reach extraordinary volumes. But the numbers that matter most to sellers may not appear in the revenue headlines.
Black Friday and Cyber Monday are approaching, and the ecommerce industry is preparing for another enormous concentration of consumer spending.
For retailers, marketplaces and advertising platforms, the headline measure of success will be sales. How much consumers spent, how quickly orders grew, which categories performed best, and how much revenue shifted online.
For ecommerce businesses, however, the more consequential question is what remains after those sales are fulfilled.
A holiday promotion can deliver record revenue while producing weaker contribution margins, greater inventory exposure and increased pressure on cash flow. Higher conversion rates may improve advertising efficiency, yet deeper discounts, fulfillment charges and product acquisition costs can absorb much of that advantage.
The distinction between sales performance and financial performance is becoming one of the defining management challenges of Q4.
This year's Black Friday conversation therefore deserves to extend beyond revenue forecasts and promotional tactics. It needs to address the economics of the holiday order itself.
1. The $275 Billion Holiday Forecast: Revenue Growth Is Not Profit Growth
Adobe's September 28 holiday forecast gives this discussion a powerful factual foundation.
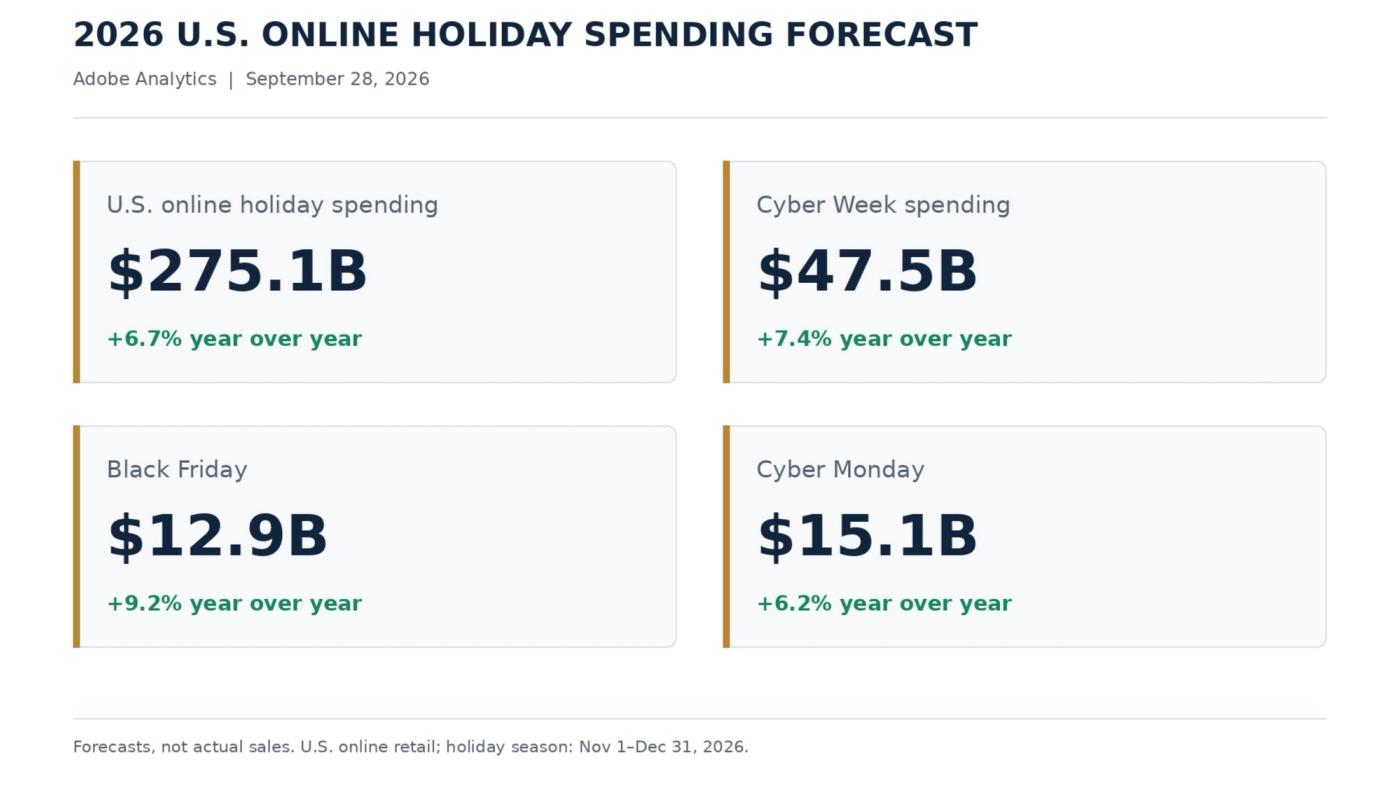
The forecast points to a remarkable commercial opportunity. But it also introduces an important distinction.
The $275.1 billion figure measures expected consumer expenditure. It does not measure how much profit retailers will earn from that expenditure.
Adobe also anticipates promotional discounts reaching as high as 30% in certain categories. The implication is that a significant portion of holiday demand will be influenced by price incentives.
That matters because a retailer can simultaneously experience stronger traffic, improved conversion, increased order volume and lower contribution profit per order.
A 20% discount, for example, is not a 20% reduction in profit. Its effect depends on the product's original margin, variable fulfillment costs, advertising expenditure and the proportion of orders that would have occurred without the promotion.
For management, the relevant measure is therefore not promotional revenue in isolation, but the incremental contribution generated by the campaign.
2. Amazon's Peak-Season Fees Add Another Variable
October 15 marks the beginning of Amazon's 2026 holiday peak fulfillment fee period in the United States.
The fees apply through January 14, 2027, across eligible FBA, Remote Fulfillment, Multi-Channel Fulfillment and Buy with Prime services. Amazon also confirms that its existing 3.5% fuel and logistics-related surcharge applies to the relevant fulfillment fees.
This introduces a measurable cost difference between a product sold during the regular period and the same product fulfilled during the holiday peak.
The change is not necessarily large enough to determine profitability by itself. But when combined with promotional discounts and advertising expenditure, even relatively small per-unit changes can become commercially meaningful across thousands of orders.
For example, Amazon's published U.S. Low-Price FBA rate card shows that the base fulfillment fee for an eligible small-standard product weighing more than two and up to four ounces increases from $2.49 to $2.68 during the peak period, before the applicable surcharge.
The important distinction is that sellers should not apply a single estimated holiday fee increase across their entire catalog. Actual exposure depends on the product's dimensions, weight, category, fulfillment arrangement and applicable rate card.
A more disciplined approach is to recalculate expected contribution margins for the SKUs carrying the largest promotional and advertising commitments.
3. Why ACOS Can Improve While Profitability Declines
Amazon PPC performance becomes particularly important during Black Friday and Cyber Monday, when changes in customer intent, conversion rates and competition can alter advertising economics.
Consider an illustrative product sold under two different conditions.
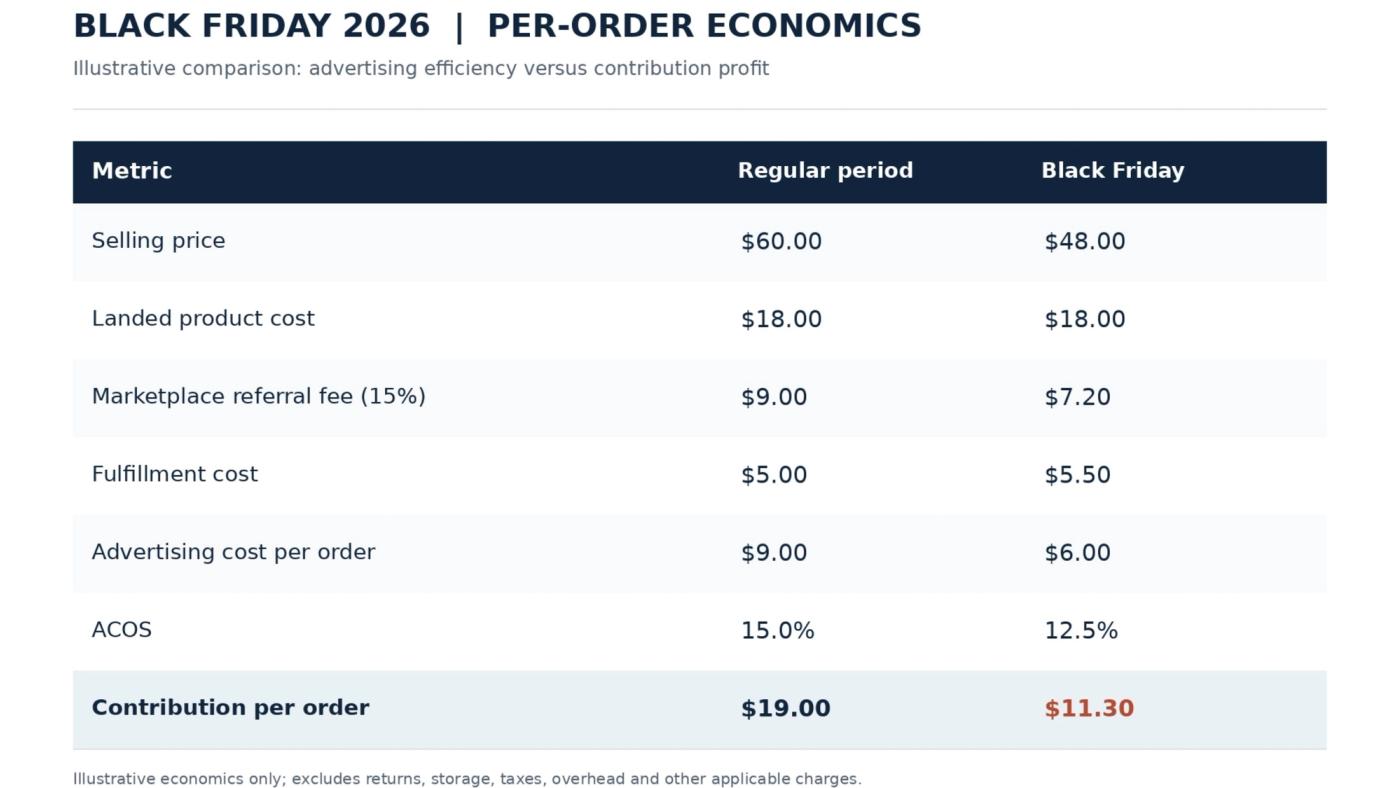
The promotional campaign appears more efficient when measured by ACOS. Advertising cost per attributed order has fallen, and ACOS improves from 15% to 12.5%.
Yet contribution per order has declined by approximately 41%.
The business would need approximately 68% more orders to produce the same total contribution as the regular-period volume, assuming the illustrated unit economics remain unchanged.
This is precisely where advertising performance and financial performance can diverge.
ACOS and TACOS remain useful management indicators, but neither independently establishes whether a promotional campaign is profitable. ACOS measures attributed advertising expenditure relative to attributed advertising sales; TACOS relates advertising expenditure to total sales. Both need to be interpreted alongside the costs of generating and fulfilling those sales.
The management question should be whether additional advertising is producing enough incremental contribution to justify the investment—not simply whether advertising efficiency has improved.
4. The Holiday Shopping Journey Is Changing, and So Is the Cost of Acquiring Customers
The 2026 holiday season is also bringing changes to how consumers discover products and complete purchases.
Adobe forecasts that AI-driven traffic to U.S. retail websites will increase 130% year over year during the holiday period. It also expects Buy Now, Pay Later transactions to account for $21.3 billion in online spending, while mobile devices are projected to generate 57.4% of total seasonal online sales.
These developments matter for a reason beyond customer experience.
As product discovery becomes distributed across search engines, social platforms, AI assistants and marketplaces, management must understand which channels generate economically valuable customers.
A channel producing high conversion rates may also attract more discount-sensitive shoppers. Another may deliver fewer orders but stronger average contribution or repeat-purchase value.
The appropriate response is not necessarily to reduce acquisition spending. It is to evaluate acquisition performance against the financial characteristics of the orders being generated.
For businesses operating across multiple marketplaces and direct-to-consumer channels, that requires consistent product-cost information, comparable advertising attribution, and a clear view of channel-specific selling and fulfillment expenses.
5. The Financial Result of Black Friday Will Not Be Known on Cyber Monday
Holiday revenue is recorded when purchases occur. The full financial consequences often emerge later.
Refunds, returns processing, unsold seasonal inventory, additional storage charges and post-holiday promotional activity can all change the profitability of the original sales period.
The National Retail Federation's 2025 Retail Returns Landscape estimated that 19.3% of online sales would be returned. This is an industry-wide estimate for 2025, not a forecast specifically for Black Friday 2026, but it demonstrates why return exposure deserves a place in promotional financial planning.
For retailers, this creates a distinction between three measures of holiday success: gross sales achieved during the event, contribution earned after variable selling costs, and contribution retained after subsequent returns and inventory adjustments.
A high-performing promotional campaign should therefore be evaluated beyond its initial revenue reporting window.
6. The Q4 Profitability Scorecard: What Management Should Measure
For executive teams, the central requirement is a consolidated view of holiday performance across commercial, operational and financial measures.
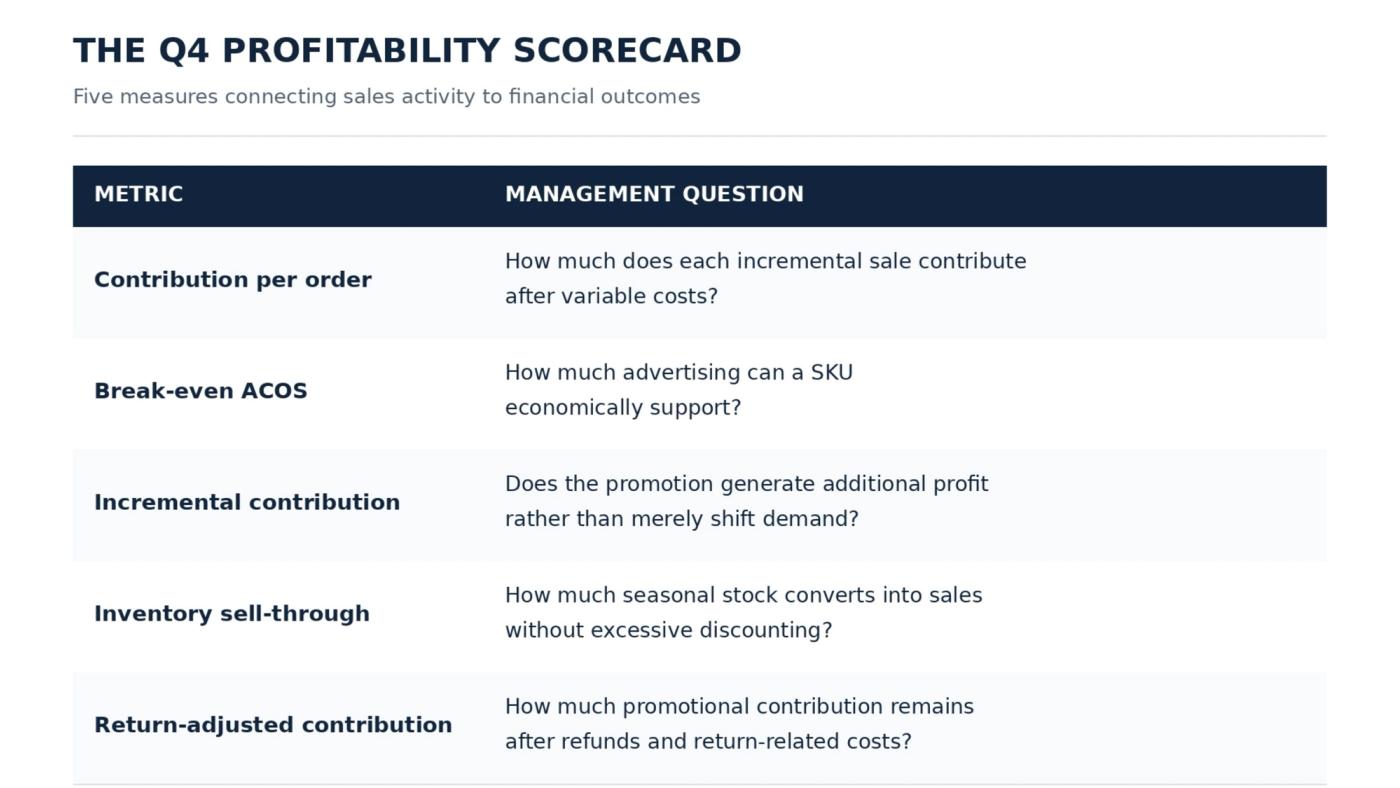
The usefulness of these metrics depends on their connection.
Advertising teams may see campaign efficiency. Marketplace managers may see revenue and conversion. Operations teams may see inventory movement. Finance may see settlement receipts and expenditure.
None of those views, in isolation, provides a complete picture of holiday profitability.
For a business managing substantial Q4 expenditure, the commercial advantage comes from bringing these measures together while decisions can still be changed.
The Crystal Magnate Perspective: Make Profitability Visible While It Can Still Be Protected
The 2026 holiday forecast illustrates the scale of the opportunity. It does not guarantee that the businesses participating in that growth will experience stronger financial results.
For ecommerce leadership, the priority is to connect advertising decisions, promotional pricing, inventory availability, fulfillment expenses and financial performance into one operating picture. Crystal Magnate addresses this challenge through its combination of ecommerce operating expertise, specialist services and proprietary technology. EcomSpine ( formerly knowsn as CMPulse ) supports connected operational management, while CM Vista provides the analytics and visibility required to evaluate business performance across functions.
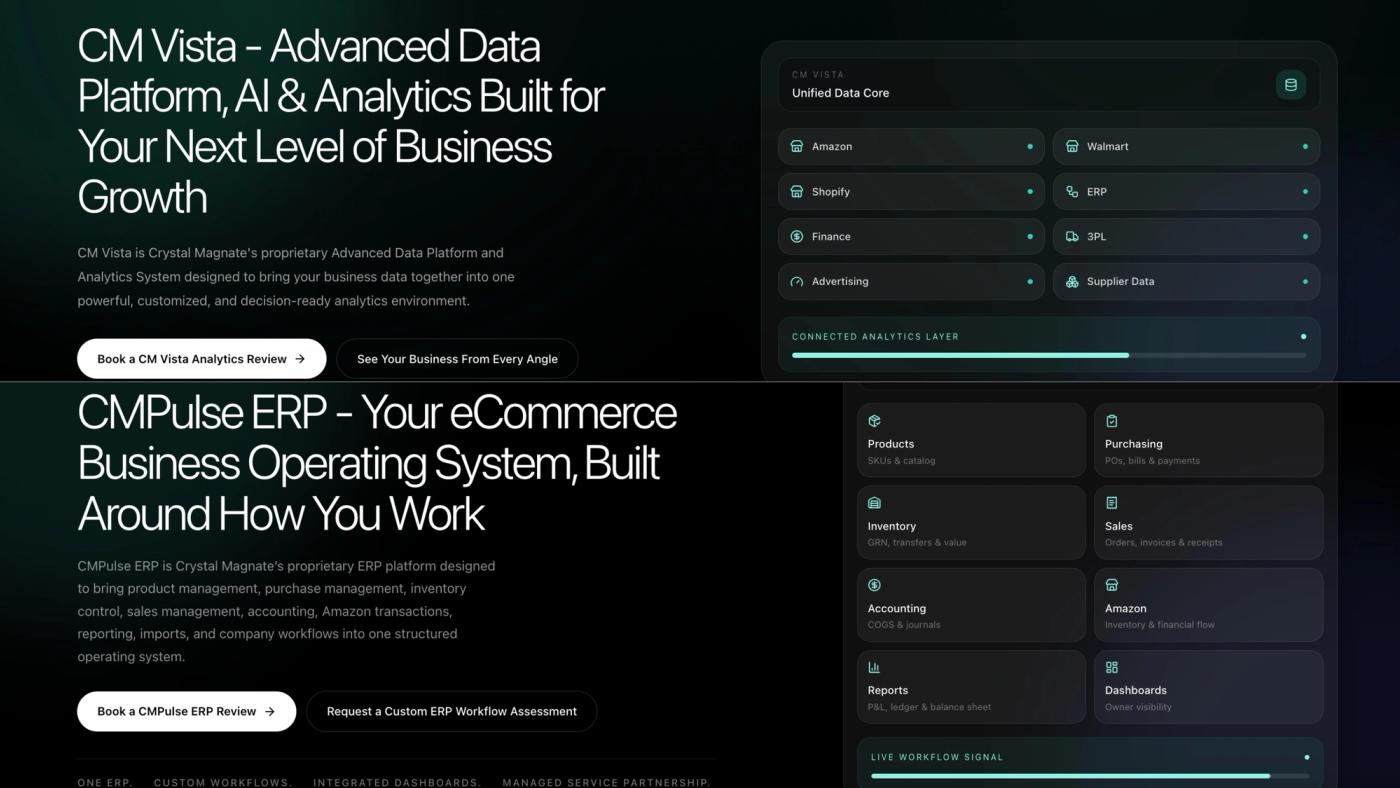
Together with Crystal Magnate's operational and financial teams, these capabilities support a more coordinated approach to managing ecommerce profitability.
The objective is not simply to identify where margins were lost after the holiday season. It is to provide the information and operating discipline needed to make better decisions while the season is still underway.
The Bottom Line
Adobe's forecast of $275.1 billion in U.S. online holiday spending is a compelling indicator of the scale of Q4 commerce.
But the industry will ultimately produce two different sets of results: the revenue consumers generated for retailers, and the profit those retailers retained.
Black Friday will reveal who captured the sales. The financial results that follow will reveal who captured the value.
Sources Adobe forecast | Amazon Seller Central | National Retail Federation (NRF) | Adobe Analytics